Companies with high levels of customer satisfaction, as measured by the American Customer Satisfaction Index (ACSI), typically do very well in the stock market. This is because they tend to have strong customer loyalty, which, in turn, has exponential positive effects on profit and revenue growth. A stock portfolio of the top scoring 30-35 ACSI companies in their respective industries, weighted by customer satisfaction elasticity to customer retention, reveals something extraordinary: A reversal of both the law of diminishing returns and the notion of high risk/high return. Accordingly, investments in the top ACSI companies tend to produce above market returns and lower risk.
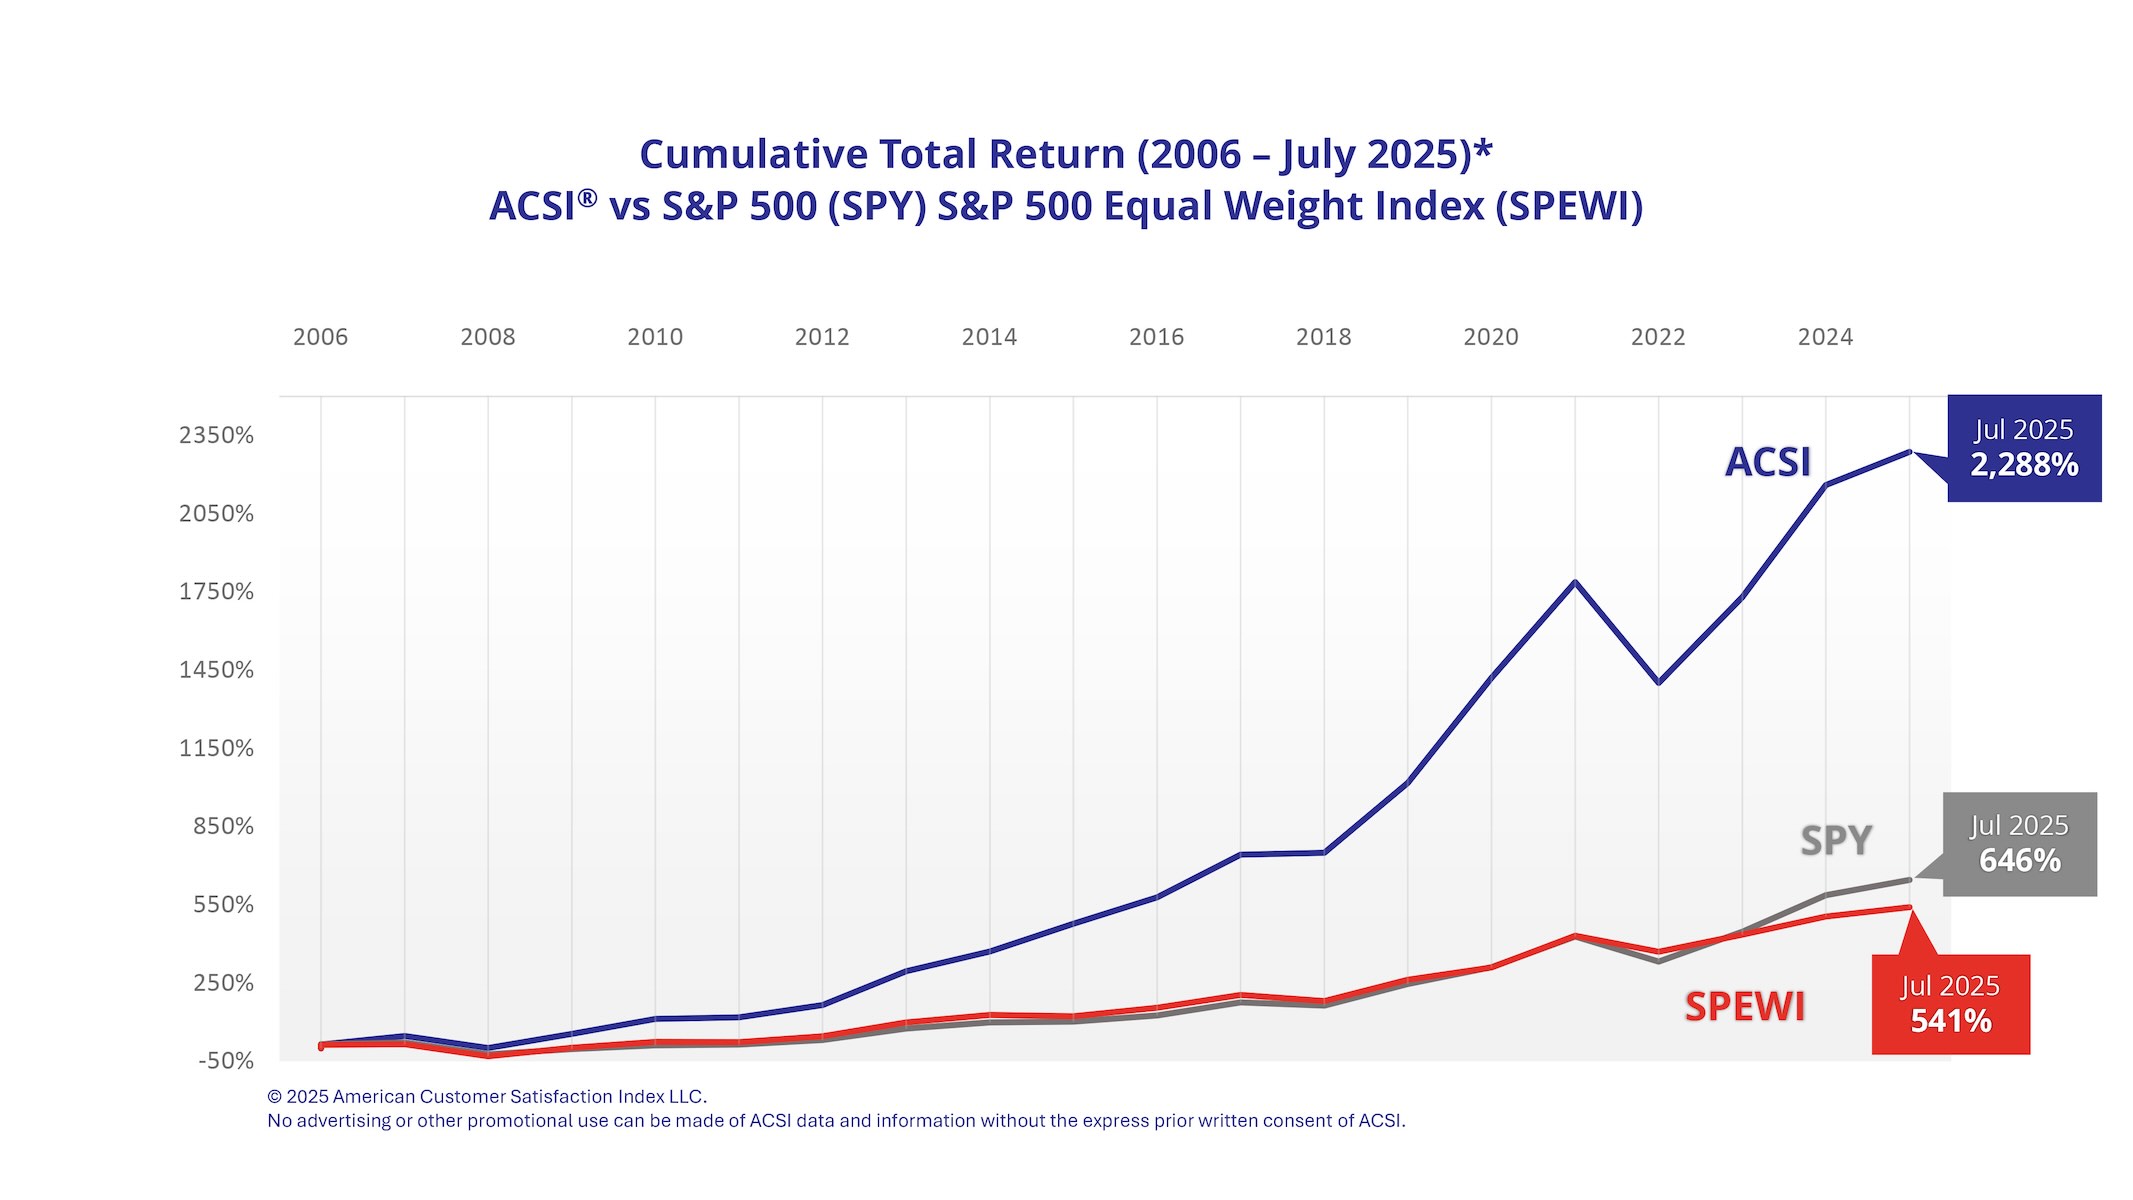
Cumulative Total Return (2006 – July 2025)
ACSI vs S&P 500 (S&P 500) vs S&P 500 Equal Weight (SPEWI)

From January 2006 through July 2025, the ACSI Leaders portfolio generated a cumulative return of 2,288% versus 646% for the S&P 500 and 541% for the S&P 500 Equal Weight Index (SPEWI), with corresponding annualized returns of 17.6% for the ACSI Leaders portfolio and 10.8% for the S&P 500 and 9.0% for the SPEWI.
Beginning in 2020 as a result of the global pandemic, there were supply constraints, labor shortages, and inflation, followed by a host of market anomalies. These issues affected not only the stock market but the economy at large, leading to an environment where consumer demand exceeded supply in many markets. This took place during a period when customer satisfaction declined substantially, with the national ACSI score dropping by a record amount from the first quarter of 2018 to the second quarter of 2022. When demand exceeds supply, there is less competition and customer satisfaction becomes less critical. Since the middle of 2022, partly due to lower buyer expectations, customer satisfaction has rebounded, hitting a new all-time high in the first quarter of 2024.
In Q1 of 2025 (and through the “Liberation Day” dip), the broader macro pressures associated with Debt/Trade/Tariff turbulence spurred market leadership beyond the "Magnificent Seven" (AAPL, TSLA, NVDA, META, AMZN, MSFT, GOOGL) and a resurgence of relative outperformance from the ACSI Leaders Index. However, the rebound from the April lows, in part due to extensions/roll back of those tariff threats, has once again returned leadership to companies spending/benefitting from the historic levels AI Cap Ex. This is reflected in where the S&P Equal Weight Index (-0.67%), the S&P 500 (-4.27%) and The ACSI Leader Portfolio (-2.19%) stood at the end on Q1 – to where they are as of the end of July - S&P Equal Weight Index (+5.8%), the S&P 500 (+8.6%) and The ACSI Leader Portfolio (+5.6%).
On a trailing twelve-month basis (7/31/2024 – 7/31/2025), the ACSI Leader Portfolio (+16.5%) outperformed both the S&P 500 (+16.3%) and the S&P Equal Weight Index (+8.9%) by 20 basis points and 660 basis points, respectively. Outperformance vs the S&P 500 benchmark can be broken down into the “Allocation Effect” – quantifying the relative benefit we received from being over/underweight individual sectors, with head/tail-winds largely being sector/macro based, and “Selection Effect” – quantifying the outperformance of the individually selected high satisfaction companies vs their broader sector peers. Year to date in 2025, we have seen significant Allocation Effect headwinds, while our individual selections continue to perform favorably against their respective sectors.
For more information on ACSI as a financial signal, please contact Josh Blechman [email protected].